Mississippi vs. the World
GDP per capita, price-level adjusted, 2024.
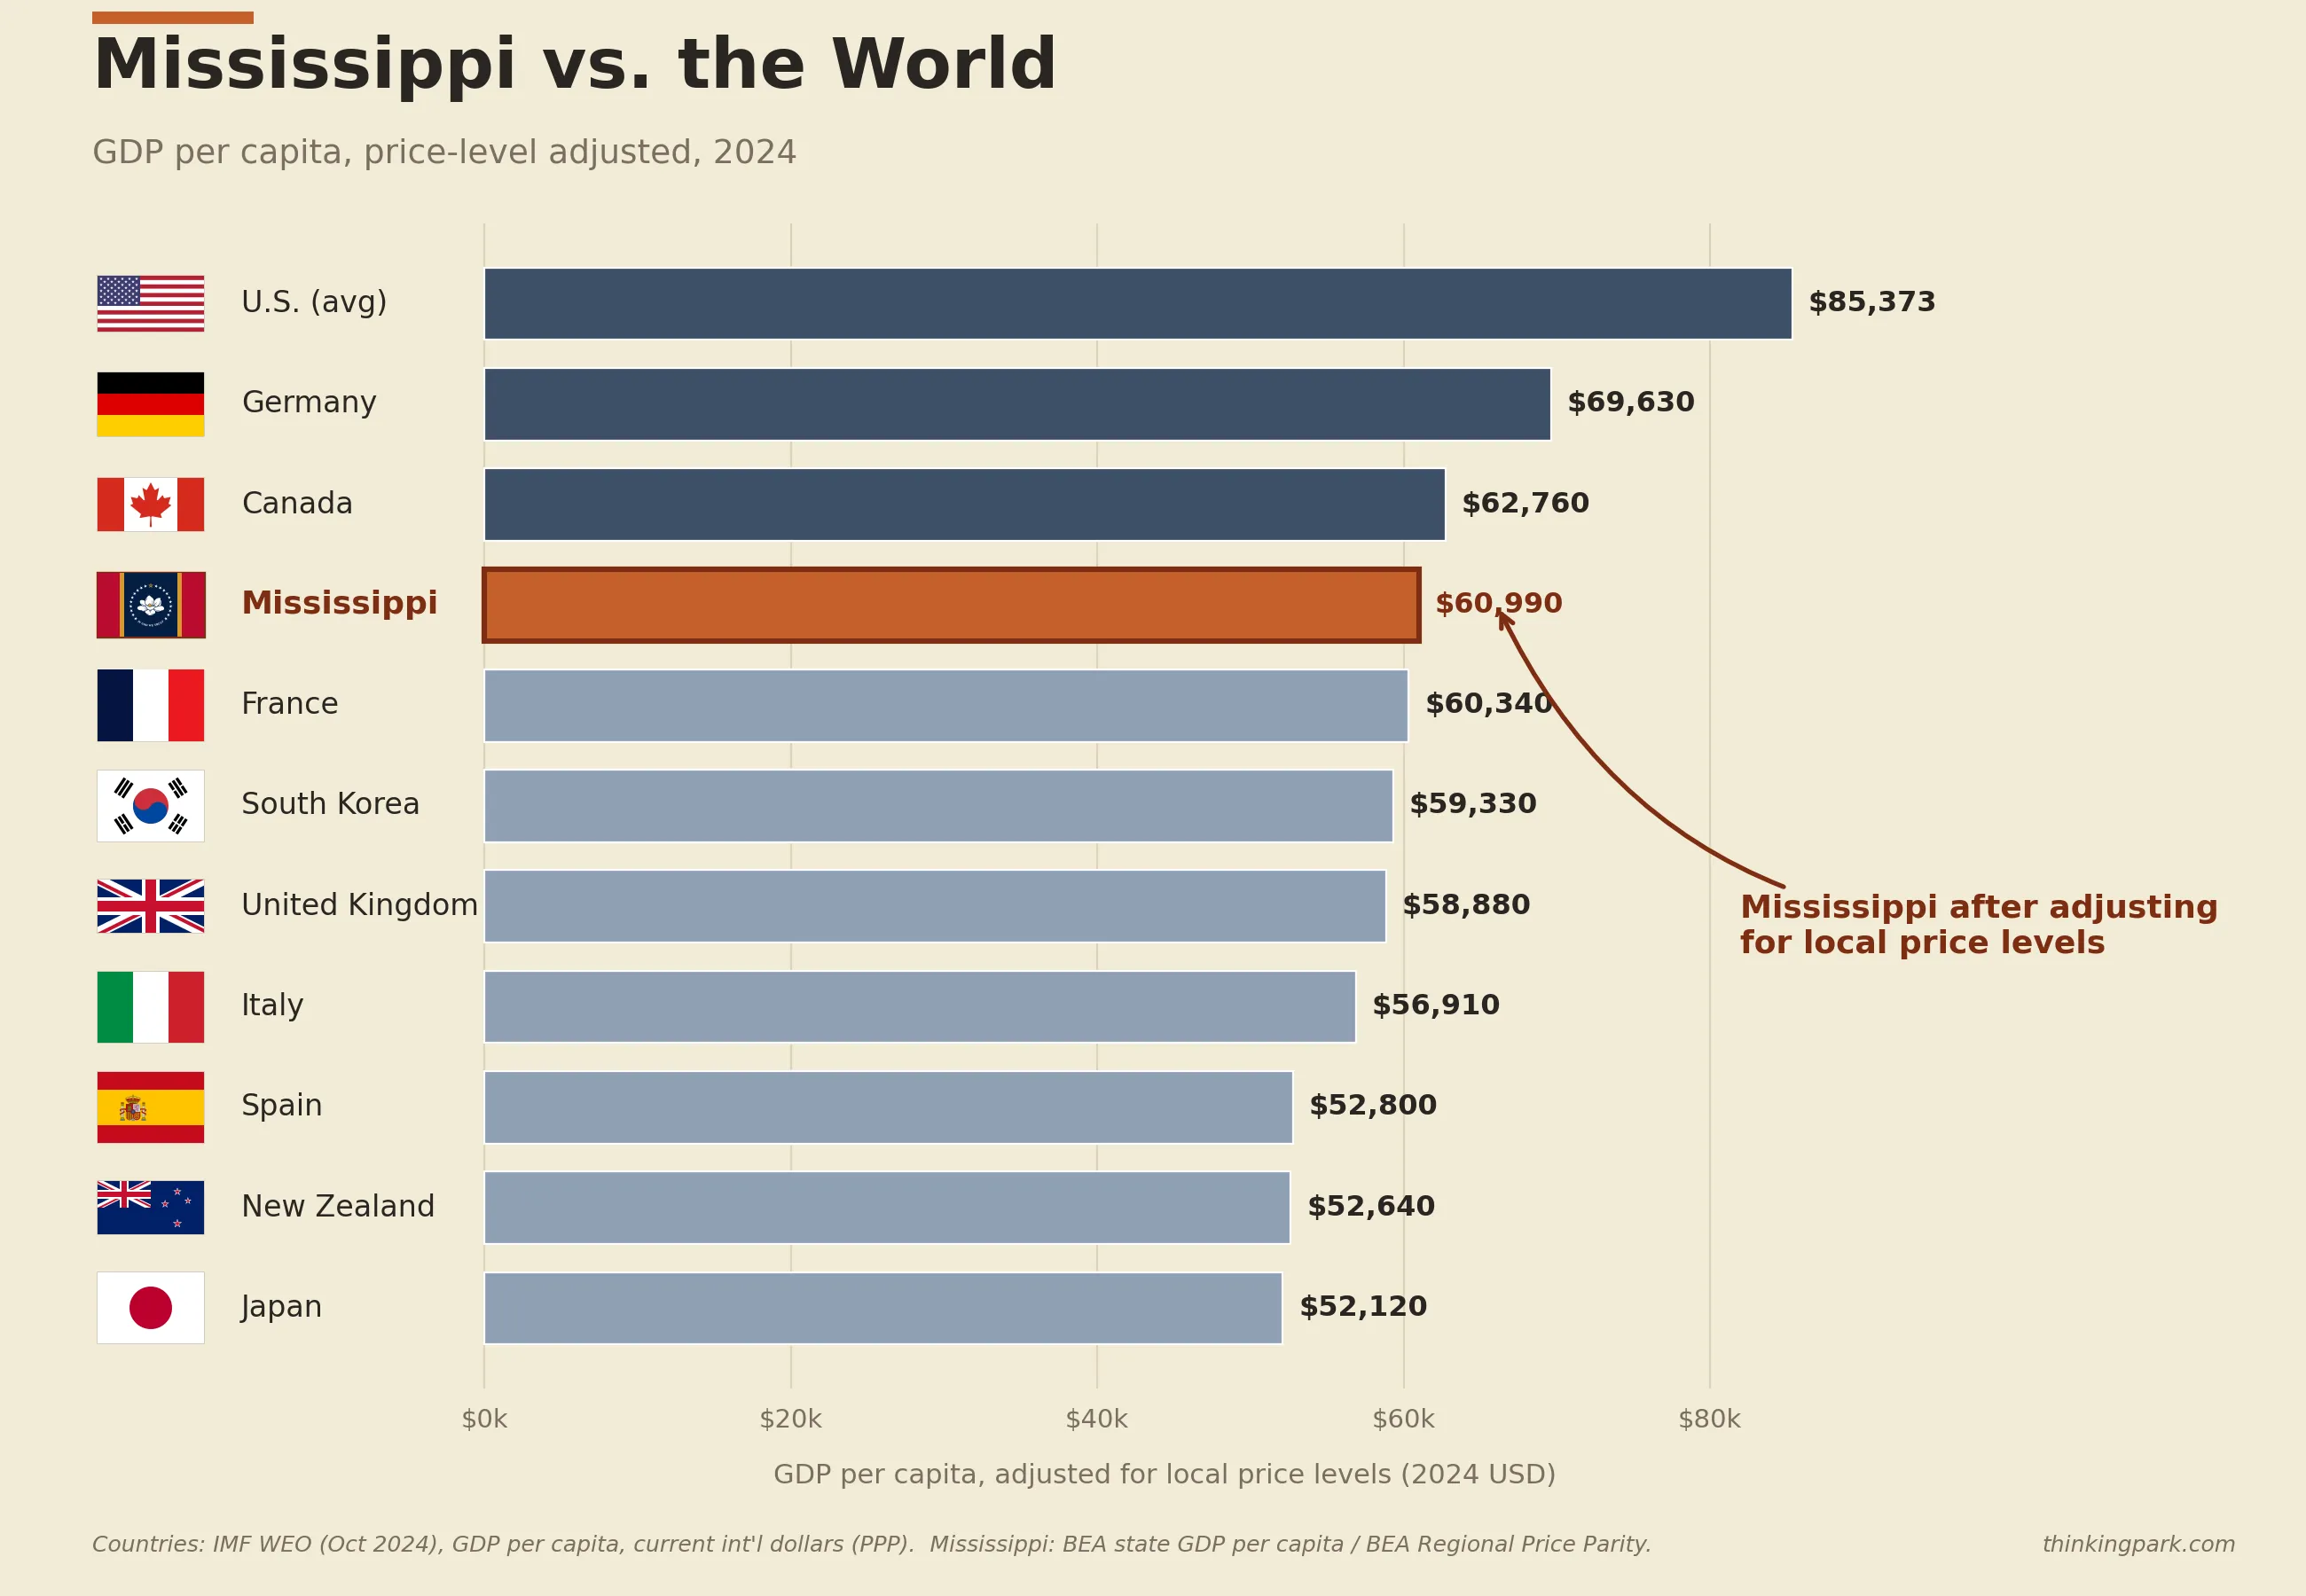
GDP per capita is one of the broadest measures of economic output. Comparing across countries requires adjusting for local price levels, what a dollar actually buys. This chart applies the same logic to Mississippi, the lowest-income U.S. state, and places it alongside ten major economies.
A note on methodology. Country values are IMF PPP, built from a global basket. The Mississippi value is nominal state GDP per capita divided by BEA’s Regional Price Parity, a U.S.-anchored basket. Same kind of adjustment, different scales. They aren’t identical statistical objects, but for developed economies the gap is small enough that a stricter construction wouldn’t move the bar visibly. Read MS as where it would land if we extended IMF’s logic into a single U.S. state.
The math: MS nominal GDP per capita was $53,061 in 2024. RPP was 87.0 (U.S. = 100). $53,061 / 0.870 ≈ $60,990.
What this doesn’t capture. GDP per capita is a useful but incomplete lens.
- Output, not income. GDP per capita captures production, not paychecks. Different metrics in theory, but the big-picture ranking doesn’t change much with median household disposable income either.
- Averages hide distribution. U.S. income inequality is wider than most of these peers. A high average says little about typical experience.
- PPP smooths the basket, not what’s in it. Universal healthcare, paid leave, and transit access don’t price out the same way across systems. A dollar-equivalent comparison can’t capture differences in what public services deliver.
- State borders leak. Mississippi residents commute, retire, and shop across state lines. National borders are stickier, making the comparison imperfect.