Nuclear Power, Mostly Built by Your Grandparents
Every commercial nuclear power plant ever built, colored by the decade its first reactor came online. Of 263 plants worldwide, 64% started up in just the 1970s and 80s.
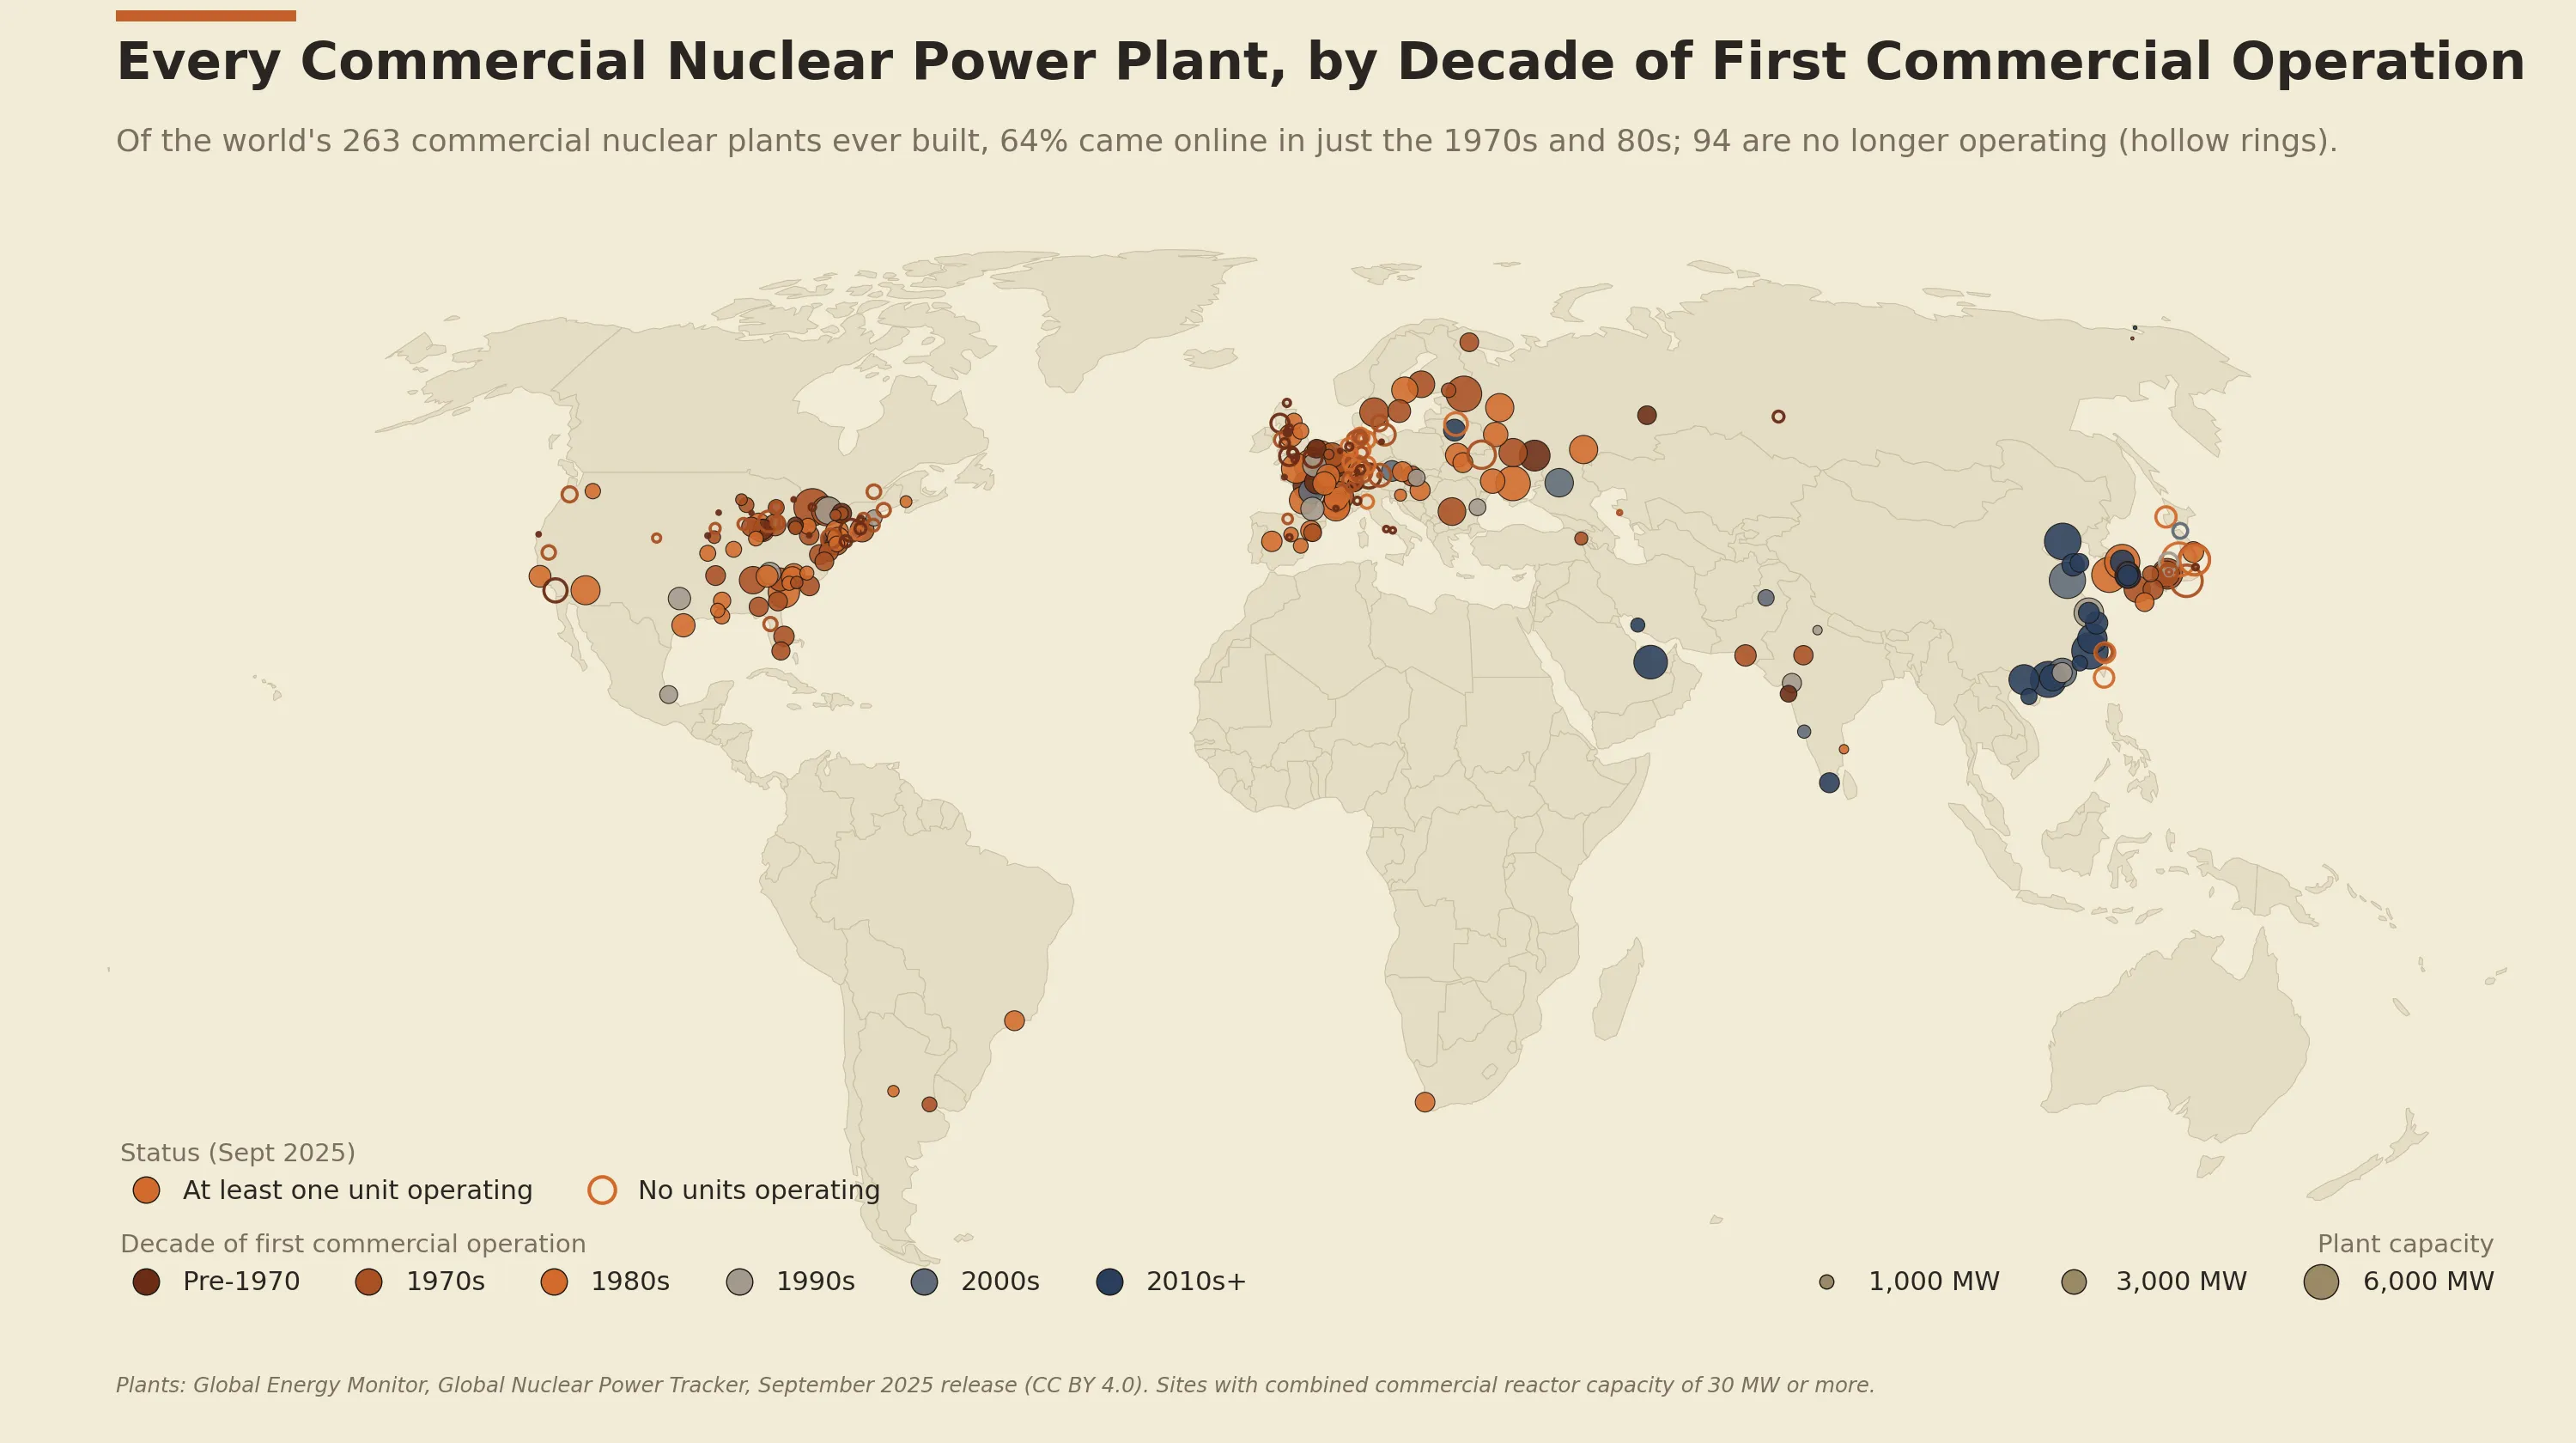
Each dot is a site, sized by its total reactor capacity and colored by the decade its first reactor came online. Nearly two-thirds of every plant ever built (169 of 263) started up in a single twenty-year burst across the U.S. East Coast, Western Europe, Japan, and Korea, all in rust and copper.
Then the nuclear boom sort of fizzled out. Chernobyl in 1986 and the lingering shadow of Three Mile Island, and the world basically quit building for a generation: just 15 plants in the 1990s and 8 in the 2000s. The slate and navy dots strung along eastern China are nearly the whole 21st-century story. Everywhere else, nuclear power is mostly something an earlier generation built.
Hollow rings mark the 94 sites where no reactor is currently running: Germany’s entire fleet, all of Italy’s, Chernobyl, Ignalina, much of the first U.S. wave, and several large Japanese plants (Kashiwazaki-Kariwa, Shika, Tomari) idled since Fukushima but not formally retired.
A site takes the color of its earliest reactor, so the 2010s+ count understates the modern build: most new Chinese reactors sit at older sites and inherit the older color. Only fully greenfield modern plants (parts of China’s recent build-out, Barakah in the UAE, Astravets in Belarus) show up navy.
Three regional zoom-ins, same palette and projection, make the density legible.
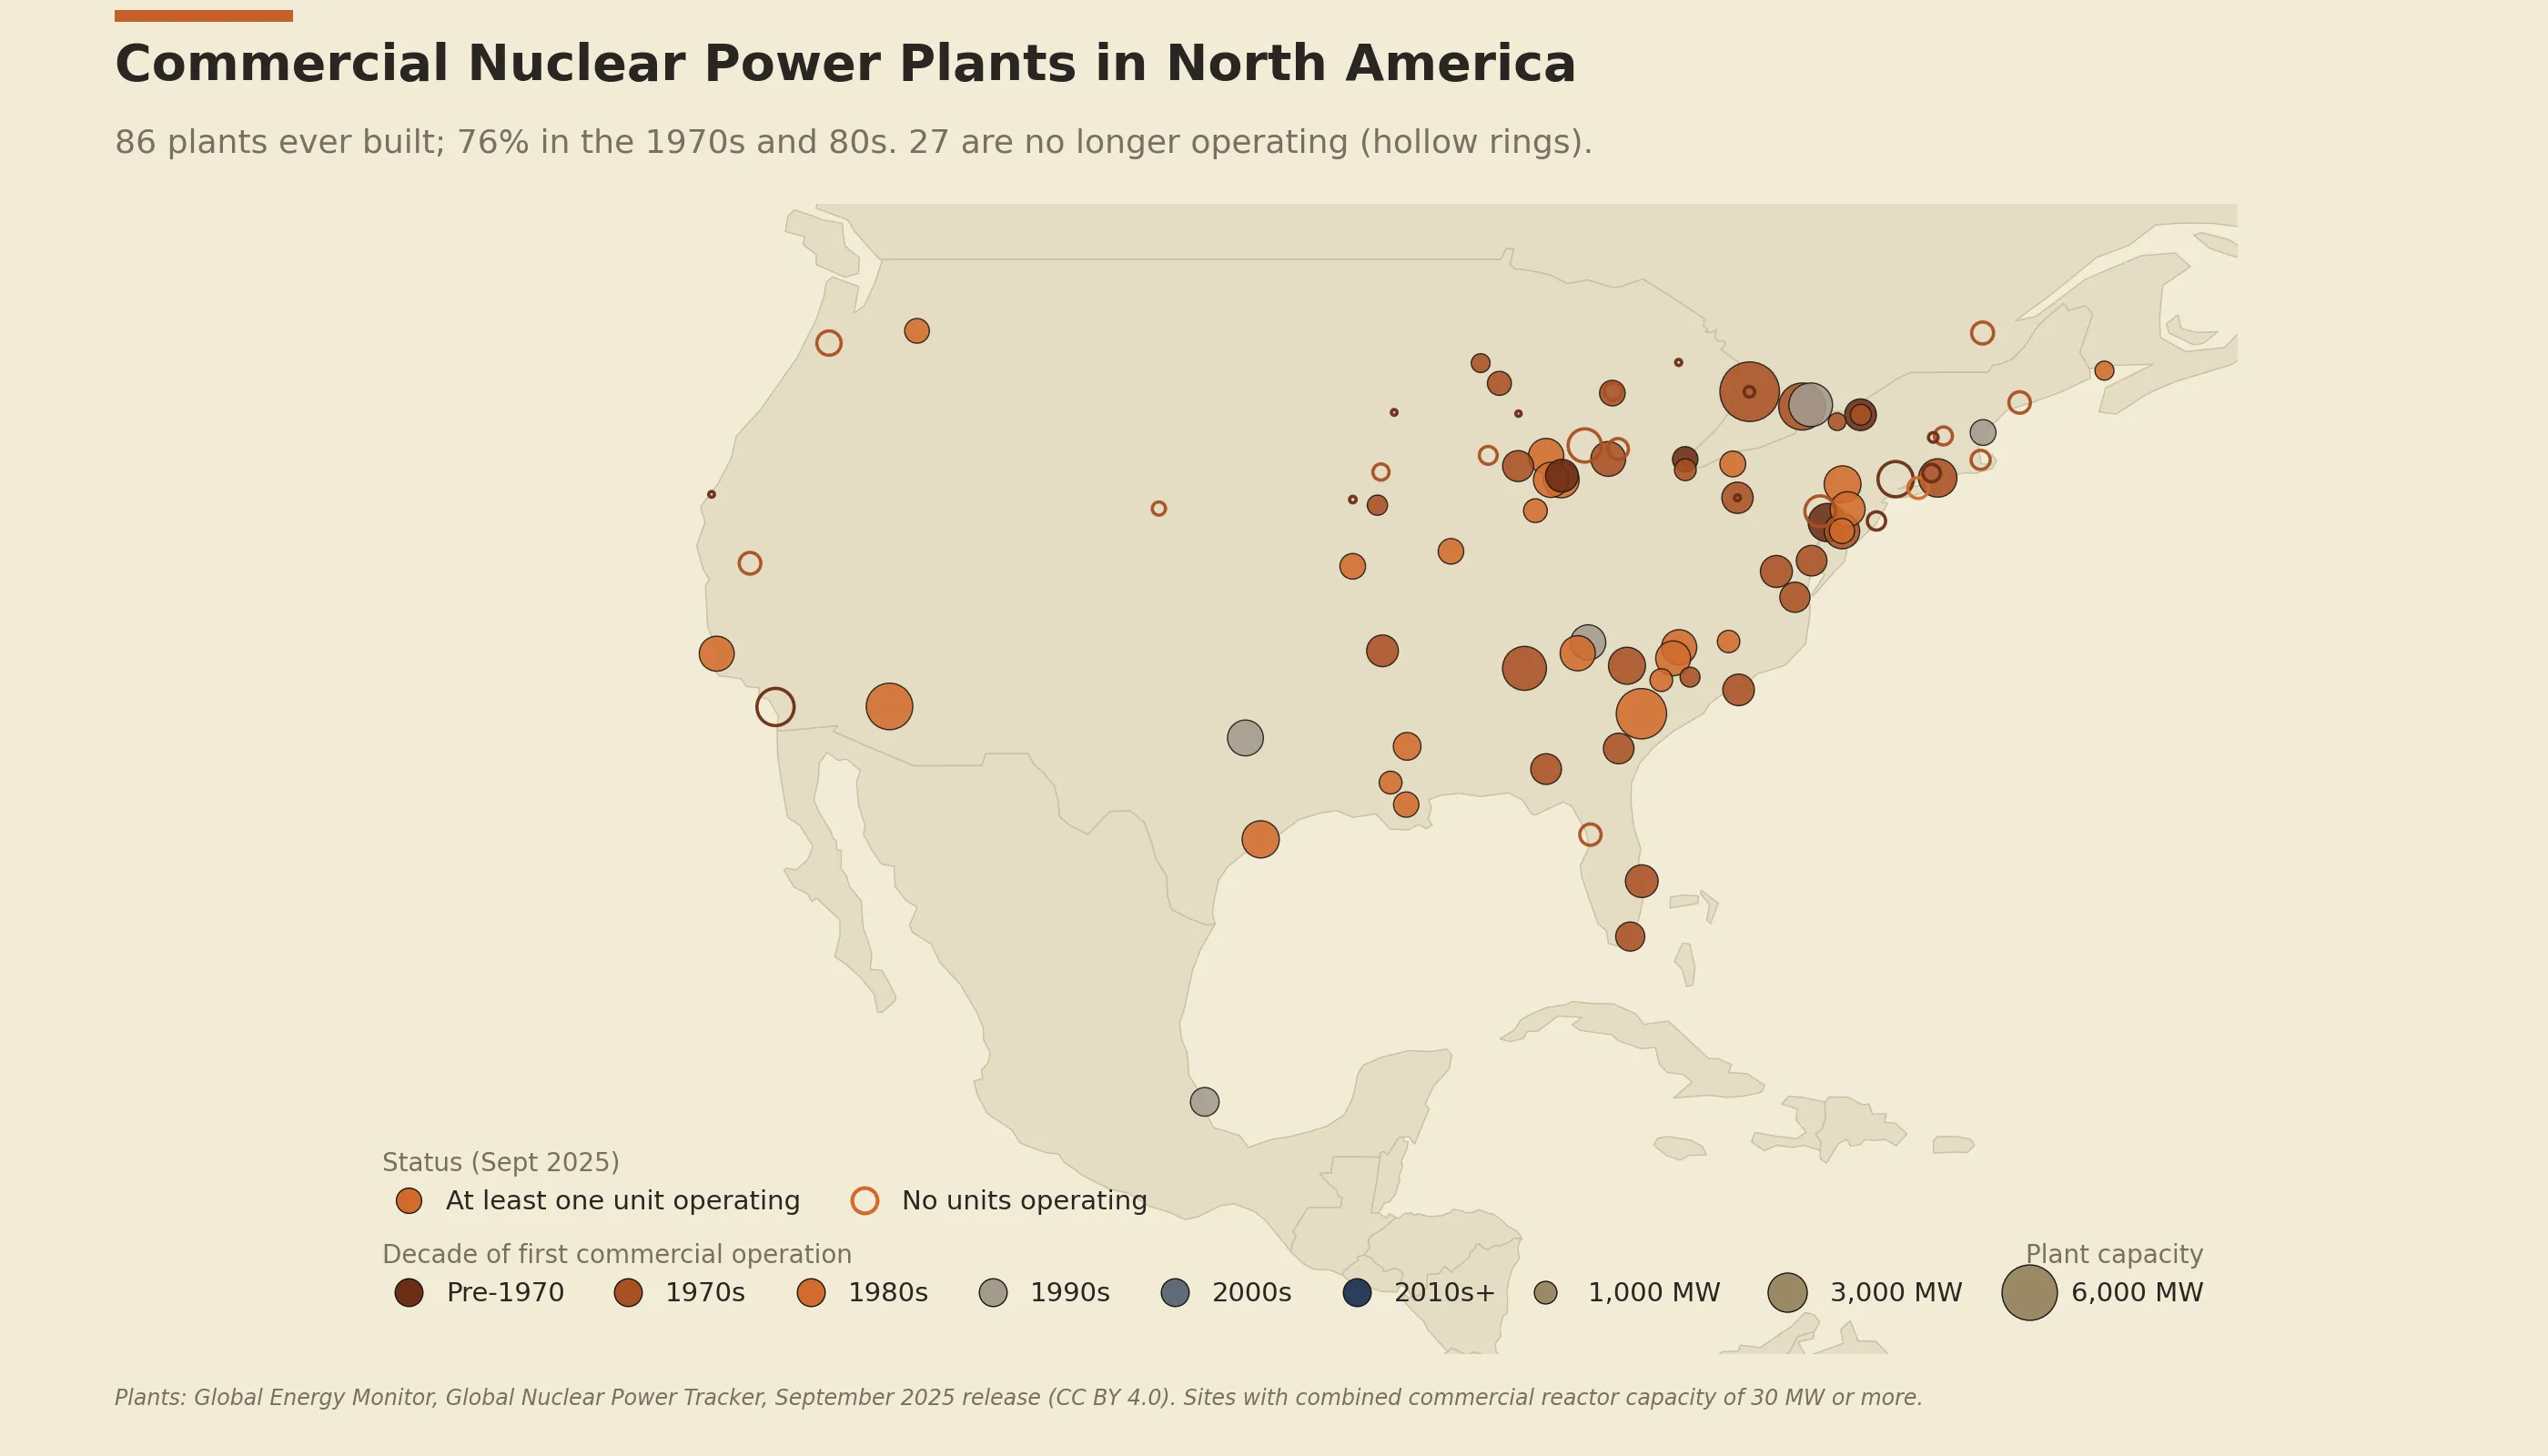
North America is overwhelmingly a 70s and 80s story (76% of its 86 plants), clustered along the U.S. East Coast and Great Lakes. 27 sites no longer operate, including early shutdowns like Yankee Rowe, Maine Yankee, and Trojan.
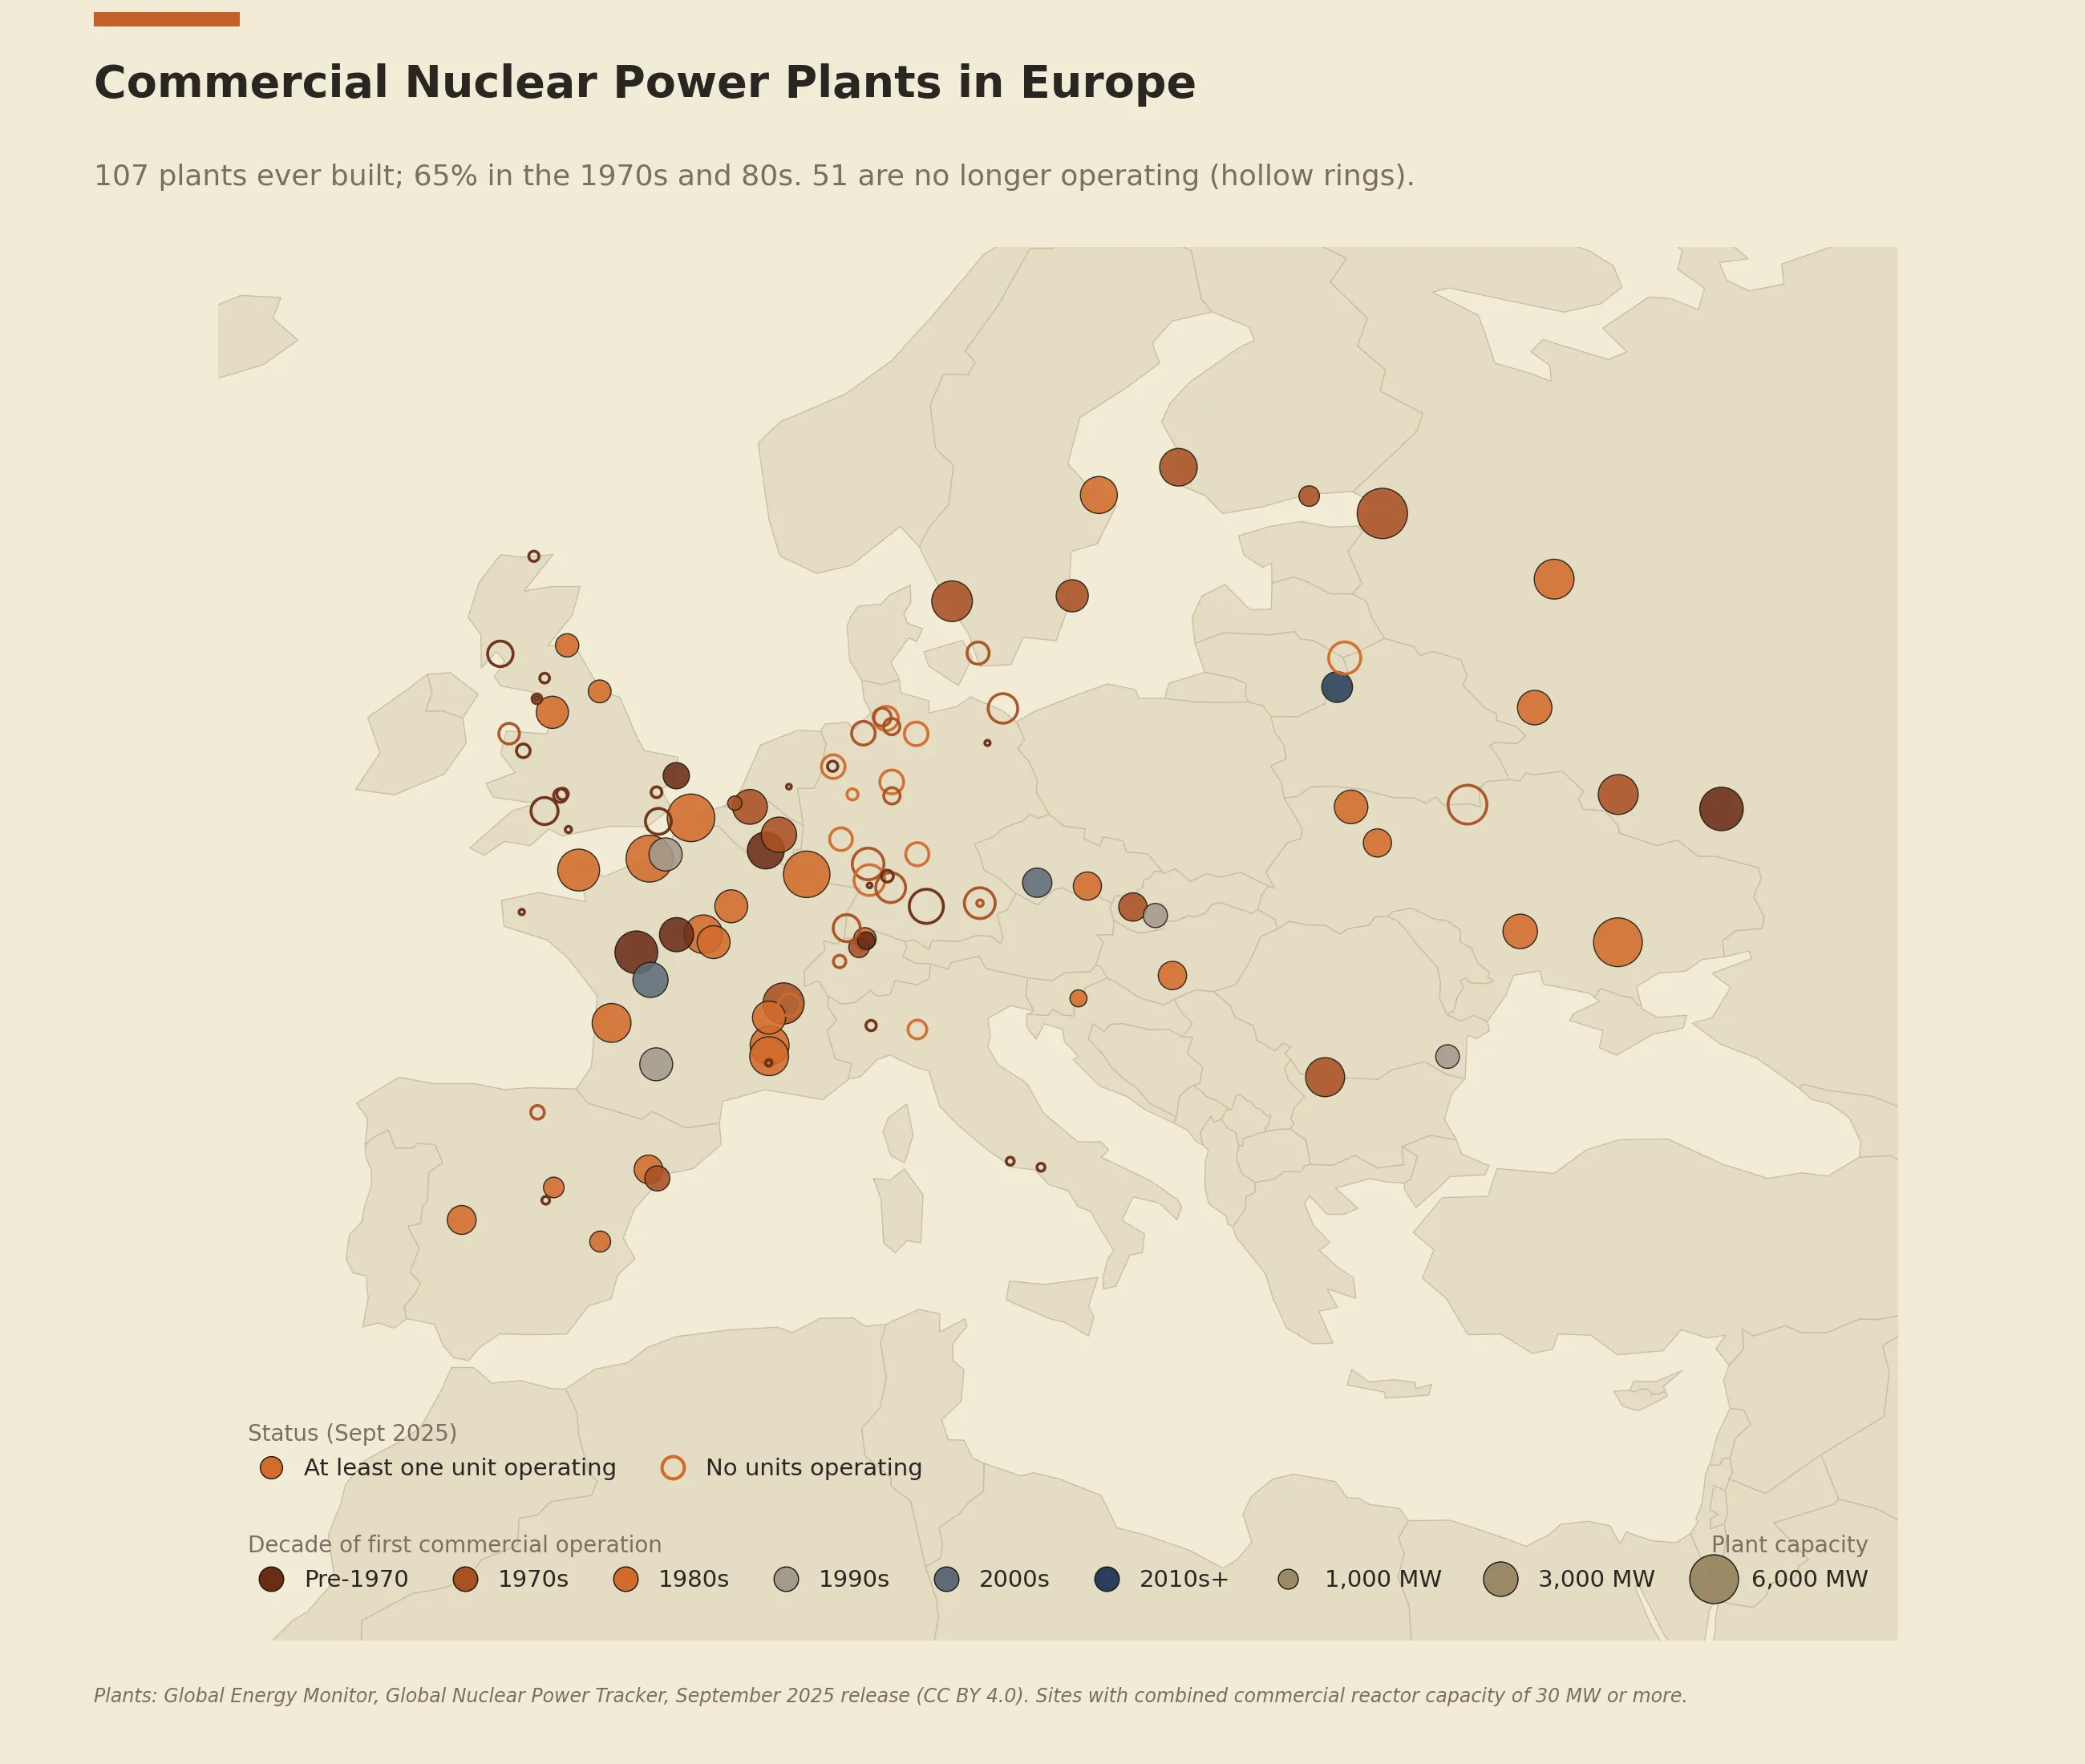
Europe has the highest inactive share of the three regions: 51 of its 107 plants are no longer running, nearly half. Germany’s entire fleet and all of Italy’s are hollow rings, alongside Chernobyl and Ignalina to the east.
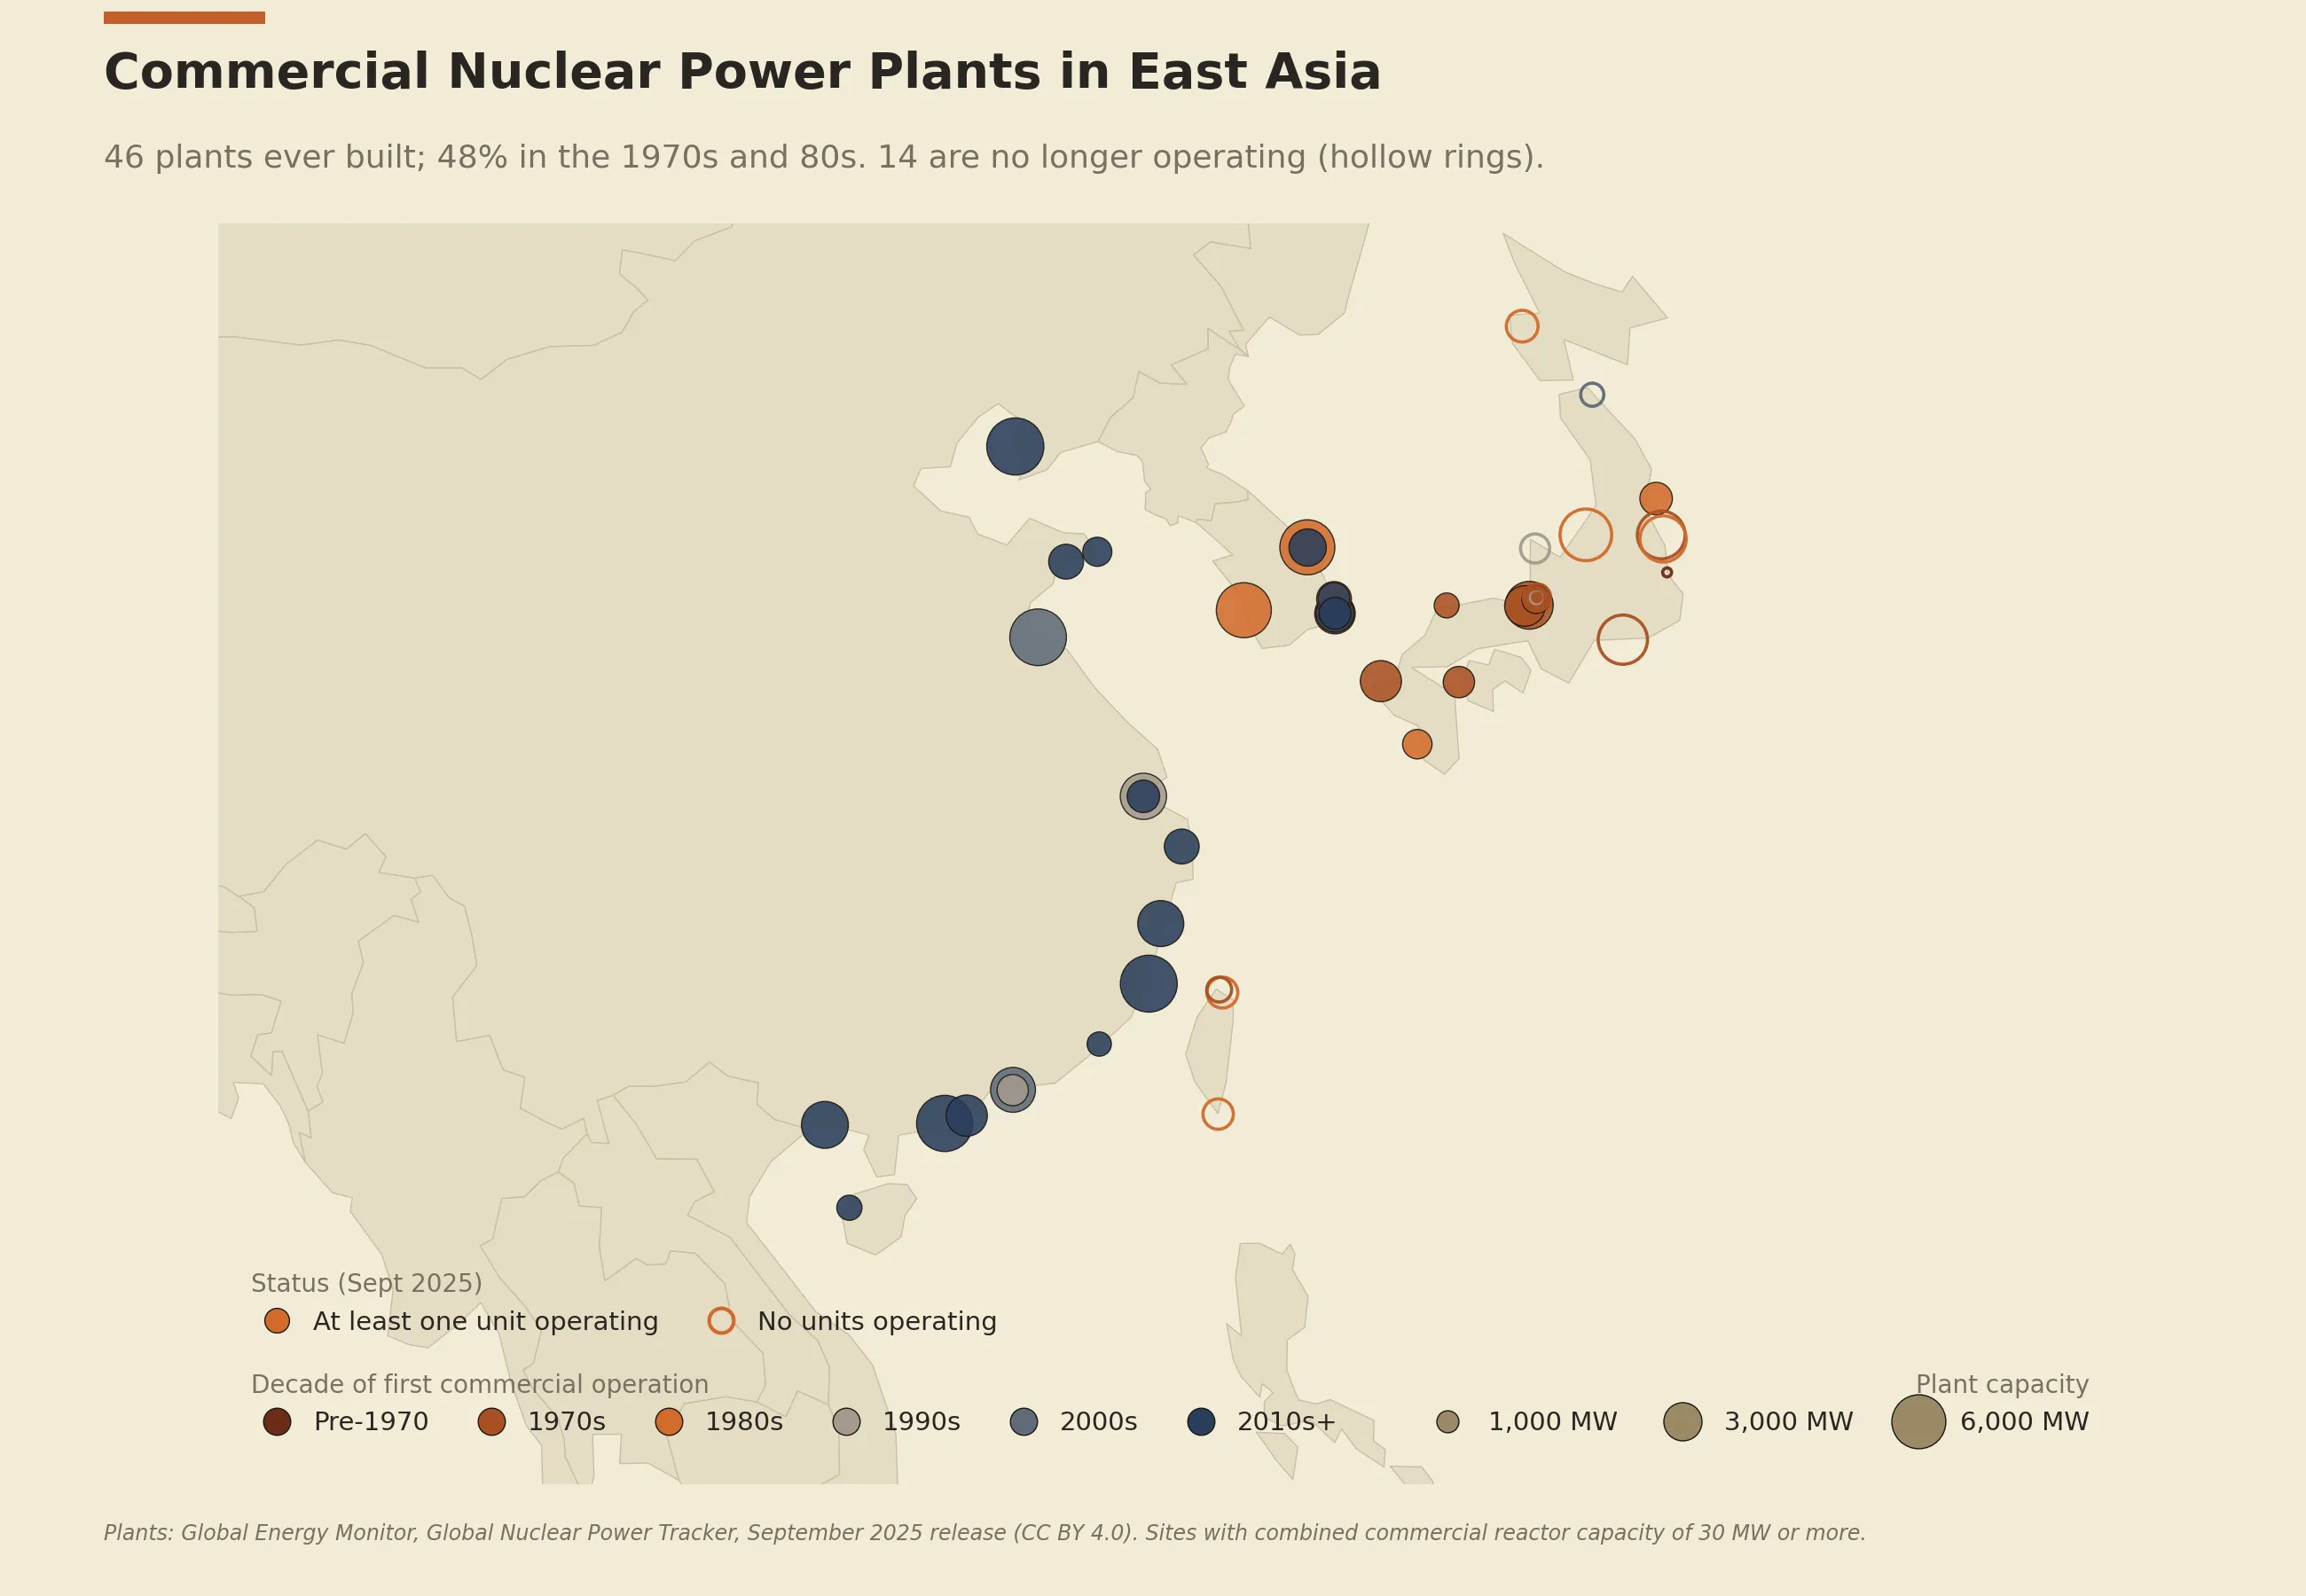
East Asia is the youngest map. Only 48% of its 46 plants date to the 1970s and 80s; the slate and navy dots along eastern China are the clearest picture of the 21st-century build anywhere. The hollow rings off Japan are the post-Fukushima idled plants, including Kashiwazaki-Kariwa, the world’s largest by capacity.